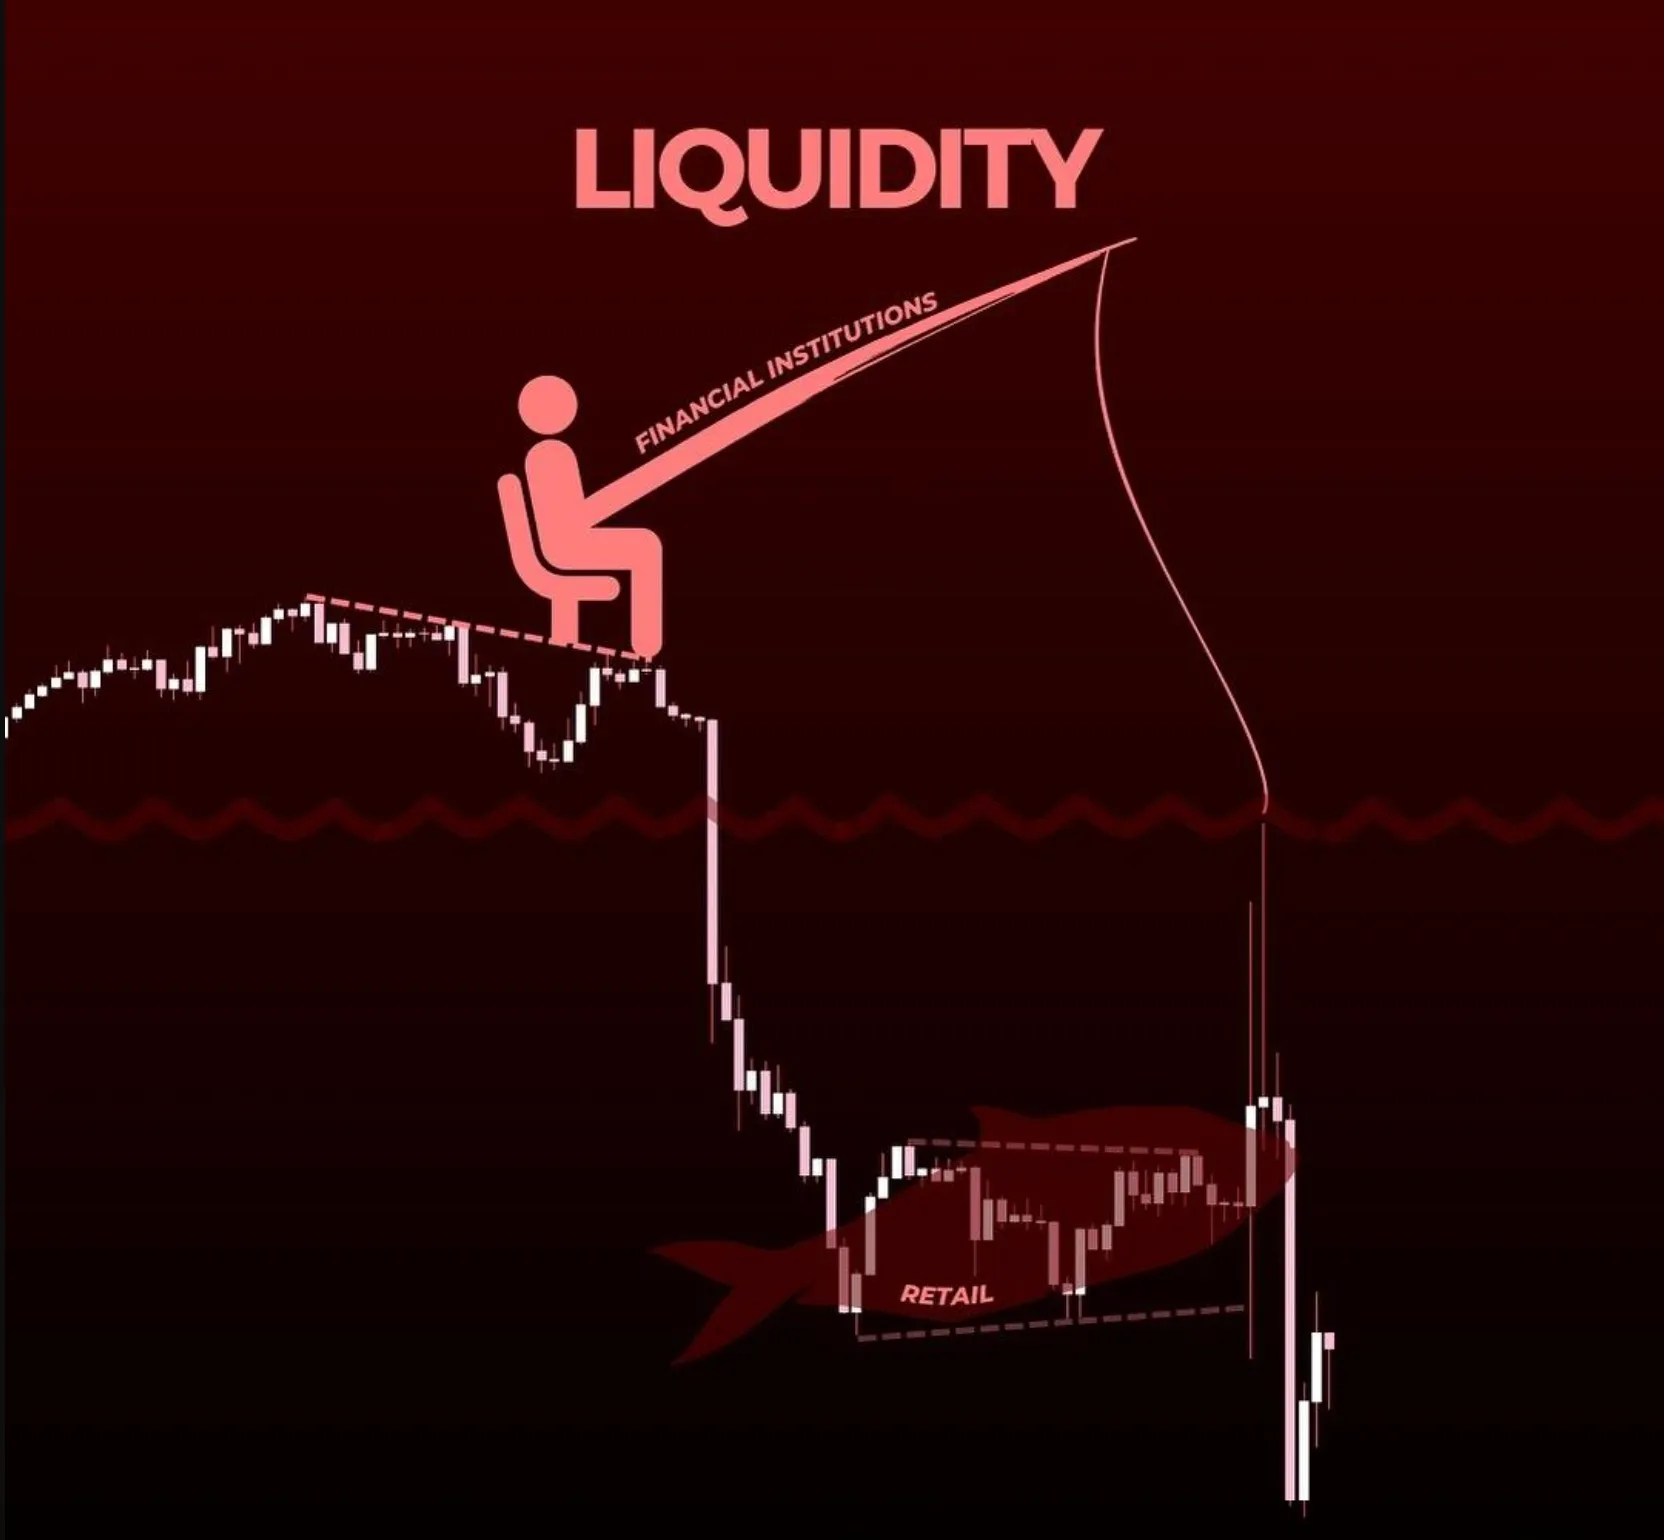
Liquidity is not simply a technical indicator but also acts as the central nervous system coordinating all value exchange activities in the digital asset ecosystem. In a market known for extreme volatility like cryptocurrency, liquidity becomes the most important measure of an asset's maturity, the system's resilience to macroeconomic shocks, and the core basis for financial institutions to participate in the market. This report, produced by Tan Phat Digital, delves into the underlying structures of liquidity, from traditional order books on centralized exchanges (CEX) to automated market making models (AMM) in decentralized finance (DeFi), and evaluates their impact on price stability and trading efficiency.
Theoretical foundation and multi-dimensional definition of liquidity
Liquidity in terminology The cryptocurrency scene is understood as the ability for an asset to be converted into cash or other types of assets quickly, efficiently, and most importantly, without causing a significant change in market price. This concept includes two interrelated aspects: execution speed (speed) and execution cost (cost/price impact). A market is considered highly liquid when there are a sufficient number of buyers and sellers ready to transact at any given time, creating a continuous and smooth financial flow.
The presence of abundant liquidity provides price stability, narrows the spread between bid and ask prices, and minimizes the risk of slippage for large trading orders. Conversely, an illiquid market — or "thin market" — will become extremely sensitive to any trading impact. Even a moderately sized buy or sell order can produce sudden price jumps, leading to "pump and dump" or flash crashes.
Characteristics comparing high and low liquidity markets:
Price volatility: In highly liquid markets, volatility is typically low and predictable. In low liquidity markets, volatility is very high and difficult to predict.
Bid-Ask Spread: Very narrow in high liquidity markets helps reduce transaction costs; Meanwhile, very wide spreads in low liquidity markets increase risks for investors.
Price Impact: Small even with large orders in high liquidity markets; In low liquidity markets, price impact is large and susceptible to manipulation by "whales".
Slippage: Minimal or absent where liquidity is high; severe and directly affects capital performance where liquidity is low.
Asset examples: Bitcoin (BTC) and Ethereum (ETH) represent high liquidity; New tokens or small-cap meme coins often have low liquidity.
See more: Compare decentralize uniswap exchange and centralize binance exchange How are they different
Technical indicators to measure and analyze market depth
To scientifically assess the liquidity situation, quantitative analysts at Tan Phat Digital rely on a set of integrated indicators, including trading volume, order book depth and actual slippage index.
Trading Volume and market authenticity
Trading volume measures the total amount of assets converted within a given time frame, usually 24 hours. While high volume often comes with good liquidity, this is not a simple linear relationship. In many cases, trading volume can be inflated through wash trading techniques on disreputable exchanges.
However, when analyzed honestly, trading volume provides a look at investor interest and the strength of price trends. A price growth that comes with high volume is considered more sustainable because it reflects broad market participation. On the contrary, price increases with low volume are often a signal of manipulation or a lack of buying power, easily leading to sudden reversals.
Market Depth and Order Book
Market depth is the ability of an asset to absorb large trading orders without changing the current price trajectory. This index is concretized through the order book (Order Book) — a public list of buy orders (Bid) and sell orders (Ask) waiting to be matched.
The order book is structured according to different price tiers. Buy orders are usually sorted from high to low, while sell orders are sorted from low to high. The density of these orders creates a "shock absorber" for the market. If an order book has large "buy walls" and "sell walls", it will be difficult for the price to penetrate these levels without extreme trading pressure
Bid-Ask Spread
Spread is the distance between the highest price that buyers are willing to pay and the lowest price that sellers are willing to accept. This is one of the most intuitive indicators of market efficiency. A narrow spread (e.g. 0.01% for BTC) indicates high competition among market makers and excellent liquidity.
Slippage mechanism and risk mitigation strategies
Slippage is the phenomenon in which the executed price of a transaction differs from the expected price at the time of placing the order. This occurs most commonly when using market orders in environments with high volatility or thin liquidity.
Analyzing the dynamics of slippage
Slippage can be classified into two directions:
Negative Slippage: Occurs when the buy price is higher than expected or the ask price is lower than expected. This is the main risk that causes traders to suffer capital losses.
Positive Slippage: Occurs when an order is executed at a better price than expected (for example, the price drops immediately when the buy order is placed). Although less common, this phenomenon can still occur in markets with extreme swings in its favor.
Slippage is proportional to the size of the order and inversely proportional to the depth of the order book. An order worth $100,000 USD may not cause slippage on the BTC/USDT pair but can cause a price change of up to 10% on a trading pair of a newly listed altcoin with a small liquidity pool.
Flippage management solutions for professional investors
To protect assets from the negative effects of slippage, Tan Phat Digital recommends applying strategies The following:
Use limit orders: Allow investors to specify a specific price they are willing to trade, ensuring the executed price is not worse than the desired level.
Set slippage tolerance: On DEXs, users can set an acceptance threshold (e.g. 0.5%). If the price change exceeds this threshold, the transaction will be automatically canceled.
Order Splitting: Splitting orders into many small orders that are executed gradually over time gives the order book time to recover and reduces the overall price impact.
Using liquidity aggregators (Liquidity Aggregators): Tools that scan across many different exchanges and liquidity pools to find the most optimal execution route.
See more: What are Gas Limit and Gas Price? How to optimize Ethereum trading fees in 2026
Liquidity structure in DeFi: Liquidity pools and AMM
Different from the order book model of centralized exchanges, decentralized finance (DeFi) has revolutionized the provision of liquidity through liquidity pools and Automated Market Makers (AMM).
Principle Operation of Liquidity Pools
Liquidity Pools are smart contracts containing asset pairs (e.g. ETH and USDT) contributed by liquidity providers (Liquidity Providers - LP). Traders execute orders directly with the assets available in the pool.
To maintain the price ratio and balance between assets, DEXs use the Constant Product Formula:
x x y = k
Where x and y are the quantities of two types of tokens in the pool, and k is a constant.
The Evolution of AMM: From Uniswap V2 to V3
The development of DeFi technology has brought great improvements in capital efficiency through the Concentrated Liquidity model.
Liquidity allocation: Uniswap V2 distributes evenly along the price curve from 0 to infinity. Uniswap V3 allows focus on specific price ranges chosen by LPs.
Capital efficiency: V2 has low efficiency because most of the liquidity is never touched. V3 has very high efficiency, up to 4000 times higher than V2.
LP asset type: V2 uses ERC-20 tokens to represent shares. V3 uses NFT (ERC-721) to represent a separate position.
Slippage for users: V2 is typically higher if the pool size is comparable; V3 is significantly lower at price ranges with concentrated liquidity.
Impermanent Loss and Position Management Risk
Being an LP provides fee income but also comes with "Impermanent Loss" (IL) risk. IL occurs when the prices of the assets in the pool fluctuate compared to the time they were deposited. If LP withdraws assets from the pool at a time of large price fluctuations, the total value received may be lower than simply holding that amount of tokens in the wallet.
Estimating IL loss based on price fluctuations:
Price change of 1.25x: Impermanent loss of about 0.6%.
Price change of 1.50x: Impermanent loss usually about 2.0%.
Price change 2.00x: Impermanent loss about 5.7%.
Price change 3.00x: Impermanent loss about 13.4%.
Price change 5.00x: Impermanent loss about 25.5%.
Analyze the impact of liquidity on Price Dynamics: Extreme Scenarios
Liquidity is the factor shaping historical price movements.
Pump and Dump Phenomenon in Low Liquidity Markets
In illiquid markets such as new altcoins, prices are easily manipulated. Groups of whales can use small capital to push prices up (Pump) and then release them massively (Dump). Due to the lack of reciprocal buying power and thin order book depth, the price will collapse vertically.
Flash Crashes and liquidity evaporation: Lessons from the event of October 10, 2025
The Flash Crash on October 10, 2025 is a typical example of the fragility of liquidity infrastructure. Triggered by the US-China tariff news, a sell-off led to a mass liquidation of $19 billion worth of leveraged positions. When Market Maker withdrew, liquidity completely evaporated.
Impact on assets during the October 10, 2025 event:
Bitcoin (BTC): Price decreased from about $122,000$ to $104,000$, equivalent to a decrease of 14%.
Ethereum (ETH): Recorded a drop in the range of 13% to 15%.
Dogecoin (DOGE): Sharp drop of up to 50% before stabilizing.
Small altcoins: Many coins fell between 70% and 99%.
Real value assessment: Relationship between Capitalization and Liquidity
Capitalization Market Cap is just a theoretical number, while liquidity is the amount of money that can actually be withdrawn.
Liquidity-to-Market Cap Ratio
Experts at Tan Phat Digital use this ratio to determine safety:
Ratio > 10-15%: Ideal level, assets have excellent resistance to manipulation risks low.
Rate 5% - 10%: Average level, safe enough for small transactions but need to be careful with large orders.
Ratio < 5%: Very dangerous, loose price structure and easy to collapse if there are large profit taking orders.
Methods to earn passive income: Staking, Liquidity Mining and Yield Farming
Staking: Purpose of securing the PoS network. Low risk (only asset price fluctuations). Low complexity, newbie friendly. Stable profits from 3-10% APR.
Liquidity Mining: Purpose of providing trading liquidity. Medium risk (with IL risk). Medium complexity. Profits fluctuate depending on transaction fees.
Yield Farming: The goal is to maximize capital gains. High risk (system risk, code errors). Very high complexity, requires experience. Profits are very high but not stable.
Practical Workflow: Using DexScreener to Analyze Liquidity
Search and Filter: Use exact contract addresses. Remove tokens with liquidity under $10,000$ USD or that have been launched for less than 1 hour.
Evaluate Liquidity Index: Prioritize tokens with liquidity over $100,000$ USD to reduce price impact.
Analyze Volume/Liquidity Ratio: Monitor activity to identify wash trading.
Check Check safety: Verify whether liquidity is locked or not to avoid rug pull.
Monitor Whale Activity: Observe large wallets to identify trends of early liquidation.
10 Frequently Asked Questions about Crypto Liquidity
1. What is slippage and why does it happen?
Slippage is the difference between the expected price of a transaction and the actual price when the order is matched. This phenomenon often occurs when the market has strong fluctuations or due to low liquidity, causing the order book to not have enough depth to absorb the entire trading volume at the desired price.
2. How does the Flash Loan mechanism affect liquidity?
Flash Loan allows borrowing huge amounts of capital without collateral, with the condition that the loan must be repaid in the same transaction. Attackers can take advantage of this instant liquidity source to manipulate price oracles or drain liquidity pools through exploiting smart contract logic errors.
3. Is Impermanent Loss really a loss?
It is called "impermanent" because this loss only exists in theory while the asset is still in the liquidity pool. This loss will disappear if the asset price returns to its original level, but it will become a permanent loss as soon as the liquidity provider withdraws capital from the pool.
4. What is a safe Liquidity/Market Cap ratio?
For projects like meme coin or low-cap, a ratio above 10% (up to 15%) is considered ideal and stable. A ratio of 5% - 10% is a decent level but needs to be monitored, while a ratio below 5% is a dangerous alarm level, easily causing a price collapse or Rug Pull.
5. What is the main difference between Staking and Yield Farming?
Staking focuses on supporting blockchain network security (PoS) and generally has lower risks. Yield Farming is a more complex strategy that involves lending or providing liquidity on DeFi platforms to optimize yield (APY), which comes with high risks of smart contract failures and impermanent losses.
6. How to identify virtual liquidity or Rug Pull on DexScreener?
Investors need to check the status of locked liquidity (Locked Liquidity). If liquidity has not been locked, developers can withdraw all funds at any time. In addition, you need to be wary of tokens with sudden trading volume but thin order books or no selling function.
7. Why is Uniswap V3 more effective than Uniswap V2?
Uniswap V3 introduces a centralized liquidity mechanism (Concentrated Liquidity), allowing LPs to concentrate capital on specific price ranges instead of spreading it from 0 to infinity like V2. This helps increase capital efficiency up to thousands of times and reduce price slippage for traders in those price ranges.
8. What caused the Flash Crash on October 10, 2025?
This event was triggered by news about US-China tariffs, leading to the mass liquidation of more than $19 billion in leveraged positions. When prices dropped deeply, Market Makers withdrew, causing liquidity to evaporate and prices to fall freely in a short period of time.
9. How does MEV (Maximal Extractable Value) affect users?
MEV allows miners or bots to rearrange the order of transactions for profit. For regular users, sandwich attacks from MEV bots can expose them to higher price slippage and spikes in gas fees.
10. How to minimize the risk of negative slippage?
You can minimize slippage by: (1) Using limit orders instead of market orders; (2) Set a low Slippage Tolerance threshold; or (3) Split large commands into parts for gradual execution.
Liquidity is the best insurance for prices. Investors should prioritize assets with high real liquidity instead of relying solely on virtual capitalization. Understanding hidden costs like Slippage and IL is imperative to protecting profits. Tan Phat Digital hopes that this analysis of the order book mechanism, AMM liquidity pool and systemic risks will help investors build a safe and sustainable portfolio in the digital financial era.
Share


