In the context of global digital transformation reaching new milestones by 2026, website performance is no longer simply a technical indicator serving the information technology department. At Tan Phat Digital, we determine this is a vital factor, determining the success or failure of marketing strategies and business profitability. Modern consumer expectations, especially in a dynamic market like Vietnam, have shifted from wanting to demanding a smooth, lag-free experience. As 5G mobile network infrastructure and high-speed fiber optic cables become the norm, the line between a successful transaction and a missed opportunity is often measured in milliseconds. This report will thoroughly analyze the cause-and-effect relationship between page load speed and user behavior, and establish a performance optimization strategic framework to maximize revenue for enterprises in the 2026-2027 era.
Quantitative relationship between speed and business performance
Empirical data from large-scale studies in 2025 and early years 2026 has confirmed an iron rule: website speed is directly proportional to the ability to generate profits. Even the smallest performance degradation leads to precisely measurable financial consequences. According to the latest reports, the average page load time on mobile devices globally is now 1.9 seconds, while on desktop it is 1.7 seconds. However, leading websites are trying to bring this number below the 1 second threshold to gain absolute superiority in experience.
Analyzing conversion rate fluctuations according to load time
The relationship between page load time and conversion rate (CVR) does not take place in a straight line but follows a steep graph in the first seconds. A website that loads within 1 second has a conversion rate 2.5 times higher than a website that loads in 5 seconds. Especially in the field of e-commerce, users' sensitivity to speed reaches an extreme level.
Below are the details of conversion rate fluctuations based on page load time:
Under 1.0 seconds: E-commerce conversion rate reached 3.05%; Lead-gen rate reached 39% (This is the ideal reference baseline).
Milestone 2.0 seconds: E-commerce conversion rate decreased to 1.68%; Lead-gen rate is 34% (corresponding to a 44.9% decrease in estimated revenue compared to the 1 second mark).
3.0 second mark: E-commerce conversion rate is only 1.10%; Lead-gen rate is down to 29% (63.9% reduction in estimated revenue).
Milestone 4.0 seconds: E-commerce conversion rate is down to 0.85%; Lead-gen rate is down to 22% (72.1% reduction in estimated revenue).
Milestone 5.0 seconds: E-commerce conversion rate bottomed out at 0.60%; Lead-gen rate is down to 18% (Lost up to 80.3% of potential revenue).
The above data proves that improving speed from 2 seconds to 1 second has the potential to nearly double online revenue. For a business with a revenue of $100,000 per day, one second of delay equates to a loss of $7,000 every 24 hours, resulting in a whopping loss of more than $2.5 million per year. In contrast, large brands that applied solutions from Tan Phat Digital have recorded significant increases in sales simply by optimizing core user experience metrics.
Influencing user behavior and brand loyalty
Page load speed not only affects whether users make a purchase or not during the current session, but also shapes their long-term perception of the brand. For every 1 second delay, customer satisfaction decreases by 16% and page views decrease by 11%. Research shows that 79% of shoppers who experience website performance problems will not return to make a second purchase. This creates a negative ripple effect: customer acquisition costs (CAC) increase as customer retention rates decrease, forcing businesses to spend more on advertising to offset user churn.
In Vietnam, where the level of competition on e-commerce platforms such as Shopee, TikTok Shop, and Lazada is extremely fierce with thousands of new sellers joining each first half of 2026, website speed becomes a strategic weapon. Vietnamese users have the habit of using multiple devices simultaneously, and their patience on mobile devices is even lower than on desktop computers.
See more: Reputable website design service at Ho Chi Minh
The psychological mechanism of Website performance
The drastic reaction of users to a slow website originates from deep psychological laws of time perception and concentration state.
"Flow" state and cognitive transition threshold
In web psychology, the concept of "Flow" state describes a state of intense concentration when the user is completely immersed in an activity. To maintain this status, Tan Phat Digital recommends that websites respond within specific time frames:
0.1 second threshold: Response is perceived as instant. Users feel they are directly controlling the interface.
1.0 second threshold: This is the limit so that the flow of thoughts is not interrupted. After 1 second, the brain begins to be aware of waiting and switches to a passive state.
Passive State: When users have to wait, they tend to overestimate the actual time by up to 36%. A web page that loads in 4 seconds will actually be perceived by the brain as having passed more than 5 seconds, increasing stress.
Weber-Fechner Law and the perception of change
Weber-Fechner Law states that people only notice change if the difference exceeds a threshold of 20%. If a business only improves speed from 5 seconds to 4.5 seconds (a 10% reduction), users will hardly feel it. To create a strong enough psychological impact, Tan Phat Digital aims to improve at least 20%, for example from 5 seconds to less than 4 seconds.
Trust in the brand is also formed in the first 50 milliseconds. A website that appears immediately creates an unconscious impression of safety and professionalism. On the contrary, delays often trigger reactions of doubt about security capabilities, leading to an immediate bounce rate.
The current state of Digital Vietnam and performance challenges in 2026
The Vietnamese market in 2026 records strong internet penetration of nearly 80% of the population. However, the uneven development between connection speed and actual experience poses many challenges.
Behavior characteristics by device in Vietnam
The differentiation in conversion rates shows that the "Mobile-first" strategy in Vietnam is not just about interface but about bandwidth optimization:
Tablet: Average conversion rate 3.1%. This is the highest group due to the combination of portability and large screen, convenient for leaving information.
Desktop: Average conversion rate 2.8%. Stable operation, often used for high value or complex transactions.
Mobile: Average conversion rate 2.8%. Most popular but easily distracted, requiring extremely high loading speeds to retain users.
Windows operating system: Recorded a conversion rate of up to 4.94%, showing that this group of users has the highest level of engagement and concentration.
Websites that are not well optimized for capacity by Tan Phat Digital will have great difficulty retaining users in areas with weak signal or during peak hours when using mobile networks.
In-depth analysis of the Core Web Vitals (CWV) 2026 index system
Google continues to use three core indexes as the gold standard to evaluate website performance. Failure to exceed these thresholds will decrease conversion rates and search rankings.
1. Largest Contentful Paint (LCP) – Content loading experience
LCP measures how long it takes to display the largest content element. The ideal threshold is less than 2.5 seconds. Slow LCP is often due to the server taking a long time to respond or the image size being too large to be compressed.
2. Interaction to Next Paint (INP) – Interactive Responsiveness
Since 2024, INP has become the official interactivity metric. It evaluates the latency of all interactions on the page. The ideal threshold is below 200 milliseconds. Tan Phat Digital focuses on optimizing this index by offloading complex JavaScript code on the main processing stream.
3. Cumulative Layout Shift (CLS) – Layout stability
CLS measures the sudden shift of elements on the page. The best threshold is below 0.1. This index ensures users do not press the wrong button due to content jumping while loading.
Comprehensive performance optimization roadmap from Tan Phat Digital
To increase revenue, Tan Phat Digital deploys an optimization process from infrastructure to source code:
Optimize infrastructure and connection (Backend)
Choose internal Hosting Location: Using servers in Vietnam helps reduce maximum latency and ensures operation when undersea fiber optic cables have problems. Businesses can increase revenue by up to 30% when reducing load time from 5 seconds to 1.2 seconds.
Content Delivery Network (CDN): Deploy CDN with stations (PoPs) in Hanoi and Ho Chi Minh City to quickly distribute static files.
HTTP/3 protocol: Increase connection establishment speed, especially effective on mobile networks dynamic.
Revolutionary image formats and loading methods
AVIF and WebP formats: Reduce image size by up to 50% but still maintain display quality.
Responsive Images: Provide image sizes suitable for each type of device screen.
Lazy Loading & Preloading: Prioritize loading important resources at the top of the page and delay unnecessary components.
Optimize source code and interaction (Frontend)
Minimize JavaScript: Eliminate redundant code, compress and split source code (Code Splitting).
Critical CSS: Prioritize display displays the first frame so the user sees the content immediately.
Yield to Main Thread: Breaks down long JavaScript tasks so the browser is always ready to respond to user interactions.
Summary business benefits from optimization
Compress images to AVIF/WebP: Directly impacts LCP, helping to reduce scaling bounce rate and save bandwidth.
Switch to domestic Hosting:Optimize TTFB index, increase stability and reduce access latency for Vietnamese users.
Delay third-party JS: Significantly improve INP index, thereby increasing cart completion rate.
Determine image size: Optimize the CLS index, helping to increase user trust and reduce unwanted wrong clicks.
Case Study
Below is a collection of 15 typical case studies that demonstrate the power of optimizing speed and user experience.
1. Vodafone (Italy): LCP optimization increases sales by 8%
Challenge: Improve the customer journey on mobile landing pages.
Solution: Optimize Largest Contentful Paint (LCP) index by handling render blocking and image compression resources.
Result: LCP improves 31%, resulting in an 8% increase in sales, a 15% increase in lead rates, and an 11% increase in add-to-cart rates.
2. Yelp: FCP Upgrade Drives 15% Conversions
Challenge: After adding the new feature for advertisers, page load time increased from 3 seconds to 6 seconds.
Solution: The development team focused on optimizing First Contentful Paint (FCP) and Time to Interactive (TTI).
Result Results:Improving FCP by 45% increases conversion rate by 15%.
3. Rakuten 24: Optimizing Core Web Vitals increases 33.13% CVR
- 36% and bounce rate decreased significantly.
4. Agrofy Market: Reduce abandonment rate by 76% while the page is loading
Challenge: Users often leave the page before the content can be displayed.
Solution: Focus on optimizing product images and reducing heavy JS load to improve LCP.
Result: 70% improvement in metrics LCP helps reduce load abandonment rate from 3.8% to 0.9% (equivalent to a 76% reduction).
5. QuintoAndar: Reduce INP increases conversions by 36%
Challenge: Slow interaction response causes frustration for users when searching for real estate.
Solution: Break up long JavaScript tasks and move part of the processing to Web Workers to reduce Interaction to Next Paint (INP).
Result: Only INP numbers decreased by 80%, helping conversion rates grow by 36%.
6. redBus: Increase sales by 7% with improved interactivity
Challenge: Low mobile conversion rate due to interaction latency.
Solution: Optimize third-party scripts and apply Single Responsibility principles to microservices to reduce TBT.
Result: Improvement INP index helps increase sales by 7% and improve search rankings in global markets.
7. Pinterest: Reduce loading time by 60%, increase signups by 40%
Challenge: A heavy website reduces the ability to retain new users.
Solution: Optimize the resource loading process and convert to modern image formats.
Result: Reduce page load time by 60%, resulting in New registrations increased by 40% and advertising revenue increased sharply.
8. AliExpress: Reduce bounce rate by 15% thanks to stable layout
Challenge: Layout jumps when loading (high CLS) causing users to click wrongly and leave.
Solution: Improve CLS 10 times and optimize LCP twice.
Result: Bounce rate reduced by 15% and time Average page viewing time increases.
9. Yahoo! Japan: Reduce 98% of "poor quality" pages
Challenge: Unstable user experience affects brand reputation.
Solution: Thoroughly handle issues that cause unexpected layout shifts (CLS).
Result: 98% reduction in pages rated as bad "Poor" in Search Console, resulting in a 15% increase in page views per session.
10. Tokopedia: Increase session duration by 23%
Challenge: Large e-commerce website has problems with main content display speed.
Solution: Test SSR (Server-Side Rendering) techniques for LCP elements and build a real-time performance monitoring dashboard.
Result Results:LCP improved by 55%, helping average session duration increase by 23%.
11. Mobile World: Optimizing the "ultra-light" Frontend for mobile
Challenge: Maintaining extremely fast access speed for millions of sessions per day in Vietnam.
Solution: Do not use a heavy framework, optimize the product page to only 581KB, put CSS in the head tag and defer (defer) JavaScript.
Result Results:The website always loads in under 3 seconds on a real mobile environment, helping organic traffic increase by more than 1 million per month.
12. Disney+ Hotstar: 100% increase in content card views
Challenge: Users on living room devices have difficulty interacting with menus.
Solution: Reduced interactive latency (INP) by 61% through optimizing event handling logic.
Result: Weekly views of content tags doubled (100%).
13. Nykaa: Increase 28% of natural traffic from small cities
Challenge: Website has difficulty reaching users in areas with weak network infrastructure (T2/T3 cities).
Solution: Focus on improving LCP index by 40% so that the page appears faster on 3G/4G network.
Result Results:The amount of organic traffic from these areas increased by 28%.
14. Ameba Manga: Increase the number of stories read by 2-3 times
Challenge: Reading experience is interrupted due to content jumping during loading.
Solution: Improve CLS index by 10 times by pre-defining the size of frames.
Result: Number of stories read by users increased 2 to 3 times.
15. Shopee Vietnam: Data automation breaks through Marketing efficiency
Challenge: Manually managing thousands of advertising campaigns and performance data causes delays.
Solution: Deploy an automation system to synthesize data from Meta, Google, TikTok Ads.
Result: 50% off reporting time, allowing the team to optimize campaigns faster, maintaining market share leadership (56%) by the third quarter of 2026.
Frequently Asked Questions (FAQs) on Website Speed and Conversion 2026
What is the average website speed in 2026? A well-optimized website today loads in about approx. 1.3 seconds. The global average is 1.9 seconds on mobile and 1.7 seconds on desktop.
How does a 1-second delay affect conversions? Each 1-second delay can reduce conversions by 7%, page views by 11%, and customer satisfaction by 16%.
How long will users wait before leaving? Approx. 53% of mobile users will leave a page if the website takes more than 3 seconds to load content.
Does website speed affect actual revenue? Yes, a business with revenue of 100,000 USD/day can lose up to 7,000 USD/day because of just 1 second of slow loading.
What is the ideal load time target? To achieve the highest conversion rate, the website should load within 1-2 seconds. Pages that take under 1 second have a conversion rate 2.5 times higher than pages that load in 5 seconds.
How does website speed affect SEO in 2026?Speed is a direct ranking factor. Google prioritizes pages with good Core Web Vitals and fast speeds to help Googlebot crawl more effectively.
Can a slow website rank high? Very difficult. Even if the content is good, a high bounce rate and poor experience will cause Google to lower its rankings compared to competitors faster.
Why is mobile more important than desktop? Because more than 60% of traffic today comes from mobile and Google uses the "Mobile-first indexing" mechanism to evaluate the entire website.
How long does it take to see SEO results after speed optimization level? It usually takes 4-6 weeks for technical indicators to update and 2-3 months to see a noticeable change in search rankings.
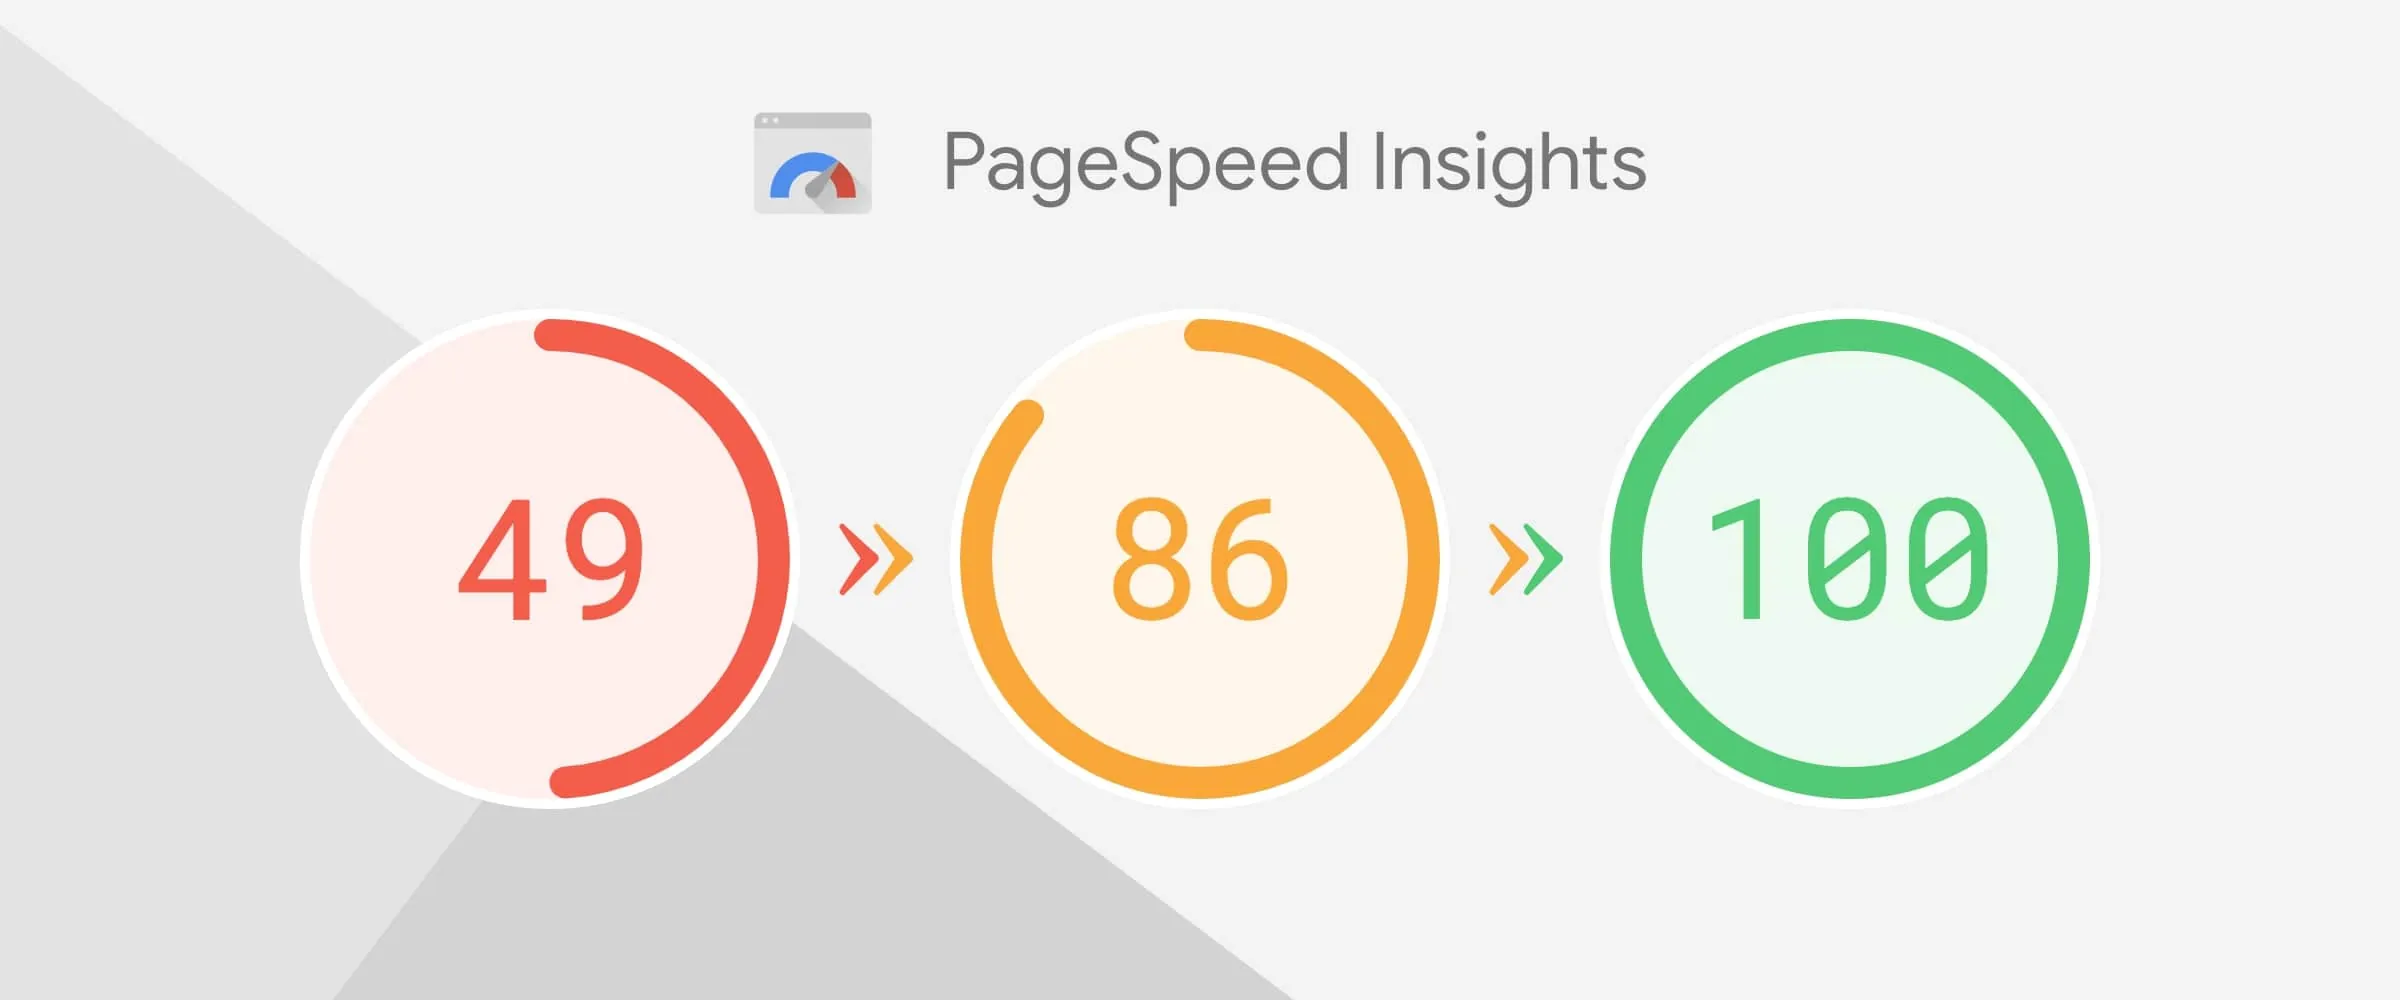
What is a "Good" PageSpeed Insights score? You should aim for a score of 90-100 (blue area). However, the actual user experience (Field Data) is more important than the simulated score.
What is the LCP index and what is the threshold? Largest Contentful Paint measures the main content loading time. The "Good" threshold is under 2.5 seconds.
How is INP different from the old FID index? INP (Interaction to Next Paint) measures the latency of all interactions during the session, instead of only measuring the first interaction like FID.
What is the threshold of INP index? A good responsive website needs an INP index below 200 milliseconds.
What is CLS and why is it annoying? Cumulative Layout Shift measures layout stability. If content jumps while loading (causing accidental clicks), CLS will be high. A good threshold is below 0.1.
How many websites currently meet Core Web Vitals standards? Currently, only about 47% of websites globally pass these tests, this is a great opportunity for you to break out compared to your competitors.
Why should you choose Hosting in Vietnam instead of internationally? Domestic hosting helps reduce server response time (TTFB) for domestic users and is not affected when the international undersea fiber optic cable is broken.
What is the ideal TTFB index? Time to First Byte should be below 500ms-800ms to ensure the browser starts receiving data as quickly as possible.
Which image format should be used for e-commerce websites? AVIF and WebP are the best options in 2026, helping to reduce image size up to 30-50% while still maintaining the sharpness of the product.
Is Google AMP still important? AMP is gradually becoming less popular. Google is currently focusing on Core Web Vitals, which allows websites to achieve high speeds without limiting features like AMP.
How does third-party source code (Zalo, Facebook Pixel) affect? These scripts can account for up to 40-70% of the total page slowdown time. Needs to be tightly managed or loads late after main content has appeared.
Website speed in 2026 is no longer a competitive advantage, but a minimum condition to survive in the market. Every 100 milliseconds of improved loading speed can translate into millions of dollars in additional revenue for large-scale businesses.
Tan Phat Digital recommends that businesses continuously measure and consider performance as a moving target. Investing in website speed is the investment with the most sustainable return on investment (ROI). When a website works faster, it not only brings in more orders but also builds a strong, trustworthy brand image in the minds of consumers - who increasingly demand perfection in every click in 2026.
Share
![[2025] How Does Page Load Speed Affect SEO? Core Web Vitals Optimal Solution for Small Businesses](https://res.cloudinary.com/dtmxgrnfn/image/upload/v1744722259/tanphatdigital/oftwerrgzswmcn7yw0ii.webp)